Articles
Federal regulations at the interface of H2 production pathways: Economic analysis of gray, blue and green H2
Special Focus: Electrolyzer Technologies
V. A. TEJEDA, M. M. EL-HALWAGI and R. ELMS, Texas A & M University, College, Station, Texas (U.S.)
Hydrogen (H2) is one of the most abundant elements, but it is only found as part of other compounds such as water (H2O) and methane (CH4). There are several pathways to extract H2 from these compounds, including natural gas reforming, water electrolysis and biomass conversion. While H2 has the potential to serve as a cleaner energy source, its most common production method has a high carbon footprint. One of the main challenges for H2 today is reducing the cost of cleaner production technologies to make H2 cost-competitive with conventional fuels.
To better understand H2’s potential role in the energy transition, it is important to consider the main production routes and how they differ in cost and environmental impact. H2 production methods are often categorized by color, based on the production process and associated emissions. The primary categories are green, blue and gray:
- Green H2 is produced using renewable energy sources such as wind or solar, resulting in emissions-free H2.
- Blue H2 is derived from fossil fuels like natural gas or coal, but with carbon dioxide (CO2) captured and stored to reduce emissions.
- Gray H2 is also produced from fossil fuels but without carbon capture, making it more carbon intensive.
Despite the range of production pathways, the cost of H2 remains the most significant barrier to widespread adoption, especially for blue and green H2.
Several specific technologies are used to produce green, blue and gray H2.1,2,3 These include steam methane reforming (SMR), autothermal reforming (ATR), partial oxidation (POX), dry methane reforming (DMR) and electrolysis. CH4 reforming technologies are commonly used to analyze the economic and environmental aspects of gray and blue H2, while electrolysis is typically used to examine green H2.
To help close the gap between clean and conventional H2, recent policy efforts have introduced financial support to encourage cleaner production. One of the most notable initiatives is the Inflation Reduction Act (IRA) of 2022, which is considered the most significant climate legislation in U.S. history. The act includes funding, programs and incentives aimed at accelerating the transition to a clean energy economy. It allocates $369 B toward clean energy and climate-related initiatives, with the goal of reducing greenhouse gas (GHG) emissions by 40% by 2030.4 The IRA offers a wide range of clean energy incentives. These either extend, increase or create new federal tax credits. Among them are the Carbon Capture and Sequestration Tax Credit (Section 45Q), and the Clean Hydrogen Production Tax Credit (Section 45V).
The Clean Hydrogen Production Tax Credit (45V) is one of the new federal tax credits introduced by the IRA. It provides a 10-yr incentive of up to $3.00/kg of clean H2 produced. The credit amount depends on the carbon intensity of the H2, with a maximum threshold of 4 kg CO₂e/kg H₂, as shown in TABLE 1.5
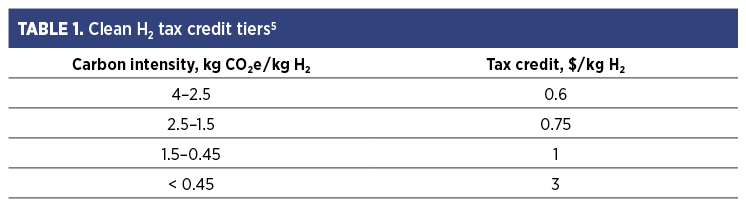
Carbon intensity is determined using the 45VH₂-GREET model, which estimates emissions up to the point of H2 production. This model, developed by Argonne National Laboratory, is a specialized version of the GREET (Greenhouse gases, Regulated Emissions and Energy use in Technologies) model.6
Alongside 45V, the Carbon Capture and Sequestration Tax Credit (45Q) is another key incentive examined in this study. First introduced in 2008 through the Energy Improvements and Extension Act, the 45Q credit was later expanded under the Bipartisan Budget Act. The IRA further increased its impact by raising the value of the credit from $50/t to $85/t of CO₂ captured and stored from industrial and power generation facilities.7 It also extended the construction deadline to January 1, 2033 and lowered the minimum capture threshold to 18,750 tpy for power plants and 12,500 tpy for other facilities.8,9 These changes have made the credit more accessible and appealing to a broader range of projects and investors.
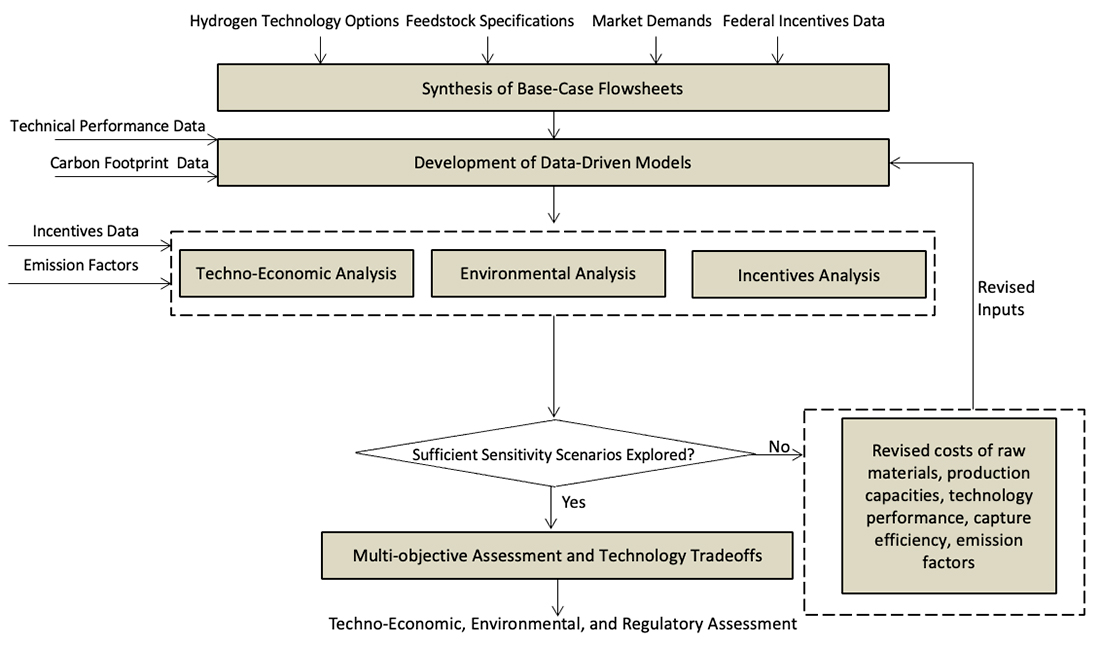
Methodology. The methodology used in this work is illustrated in FIG. 1. First, relevant data were collected on the five options for H2 production and the various specifications for the feedstocks and market. Additionally, a thorough study was conducted on the principal components for federal regulations vis-à-vis the incentives associated with the carbon footprint for H2 production. Performance data were used to create models for each technology. These models were run for a set of base conditions and then assessed through a number of what-if scenarios by altering the input and performance data within plausible ranges. The results were documented in the form of economic, technical and environmental metrics.
Problem description. Low-carbon H2 is expected to play an important role in the transition to cleaner energy systems. While green and blue H2 present promising alternatives, more than 92% of current H2 production still relies on carbon-intensive gray methods.10 Cleaner technologies like electrolysis powered by renewable energy and CH4 reforming with carbon capture offer more sustainable options, but the trade-offs between them remain unclear. In particular, the economic and environmental impacts under different regulatory and market scenarios have not been fully explored.
Federal incentives such as the Clean Hydrogen Production Tax Credit (45V) and the Carbon Capture and Sequestration Tax Credit (45Q), introduced through the IRA, aim to reduce the cost barriers of producing low-carbon H2. However, these incentives are not stackable, requiring producers to choose between them.11 This presents a challenge for blue H2, as it is unclear which credit offers the better economic benefit across different technologies, plant sizes and operating conditions.
In addition, current research does not fully address how these policies affect the long-term feasibility and adoption of H2 technologies. There is a need for a clearer understanding of how production costs and emissions are influenced by policy design, technology choice and market conditions.
The objective of this work is to assess the intersectionality of economic, environmental and regulatory issues on the selection of H2 production technologies. Specifically, five technologies are considered: SMR, ATR, POX, DMR and electrolysis. Each technology is analyzed across three main dimensions:
- Economic feasibility: A cost model was developed to estimate the price per kg of H2 without incentives, with both 45Q and 45V.
- Environmental impact: Emissions were estimated for gray, blue and green H2 to compare sustainability.
- Sensitivity to market conditions: Factors such as natural gas prices, carbon capture costs and efficiency, and electricity prices were varied to see how they affect production costs.
The findings aim to support policymakers, investors and developers by highlighting the most cost-effective production methods and the role of incentives in making low-carbon H2 more competitive. This study also identifies key factors that affect the cost of H2 and the potential trade-offs in selecting different policy paths.
Model development. For CH4 reforming technologies, the capital expenditure (CAPEX) model is based on a study that was originally developed for methanol plants, with adjustments made to reflect the needs of H2 production.1 A cost correlation was applied using the natural gas feed capacity, which is determined using stoichiometric H₂/CH₄ ratios specific to each technology. The fixed capital investment was updated to reflect 2024 U.S. dollars using a plant cost index, and annual fixed costs were calculated assuming linear depreciation over 10 yrs with a 10% salvage value.
Operational expenditures (OPEX) were estimated using a formula that considers natural gas feed rate, gas price and the H₂/CO ratio.3 Additional costs were included based on each technology’s energy demands and separation requirements. For example, thermal energy costs were added for SMR, ATR and DMR, while POX included oxygen separation costs.
For electrolysis, capital costs were estimated using data collected from seven real-world plants. A power-law correlation was developed to relate H2 production capacity to fixed capital investment, and the resulting equation was validated through regression analysis. Operational costs were primarily based on electricity usage, assuming a typical consumption of 50 kilowatt hours (kWh) per kg of H2 produced.12 Renewable wind power was selected as the energy source, and any revenue from selling oxygen byproduct was subtracted from the total operating cost.
Emissions were estimated using the 45V Hydrogen-GREET model, which calculates GHG emissions up to the point of H2 production. This model was used to estimate direct and indirect emissions for SMR and ATR under standardized conditions, while emissions for DMR and POX were approximated based on reaction stoichiometry. Electrolysis was assumed to produce zero emissions under the ideal condition of fully renewable electricity, which is consistent with results from the GREET model. For blue H2, emissions were adjusted using the assumed percentage of carbon captured.
Finally, the model uses these emissions to determine eligibility for federal tax credits, focusing on 45Q and 45V. Gray H2 does not qualify for either credit, while green H2 qualifies only for 45V. Blue H2 qualifies for both, but the credits cannot be combined. The model calculates the applicable credit based on each technology’s carbon intensity or amount of CO₂ captured.
Results and sensitivity analysis. To compare the benefits of each technology, an example with 90% carbon capture was computed. The results for this scenario are shown in TABLE 2. The amount of 45Q received varies depending on the technology, since each one produces a different amount of direct CO₂. The 45V credit also changes, as it is a tiered system and each technology has a different carbon intensity.
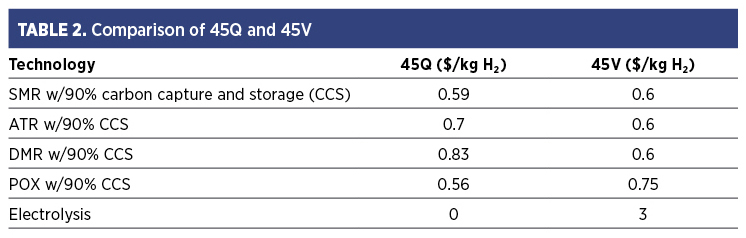
These results show that the choice of incentive depends not only on the production technology but also on the carbon capture rate. Since the 45V credit is based on carbon intensity and follows a tiered system, even small changes in capture efficiency can move a technology into a different tier, which can significantly change the value of the credit received.
To explore how these changes can affect overall cost and credit eligibility, a sensitivity analysis was performed. This analysis examined how cost varies with changes in capacity, natural gas prices, CCS costs, carbon capture percentage and GHG emissions. Each of these variables was tested across a range of values, while the rest of the inputs were kept fixed.
First, a natural gas price analysis was performed, using a range from $1.70 per thousand cubic feet (kft3) to $10/kft³ (all ft3 refer to standard cubic feet). The results highlight how impactful the cost of natural gas is on H2 production. For context, in Texas (U.S.), the cost of natural gas alone ranged from $1.88/kft³–$3.57/kft³ in 2024.13 Looking at the results shown in FIG. 2, for gray H2, this variation translates to a difference of about $0.50/kg of H₂ produced. This becomes especially important when producing millions of kg.
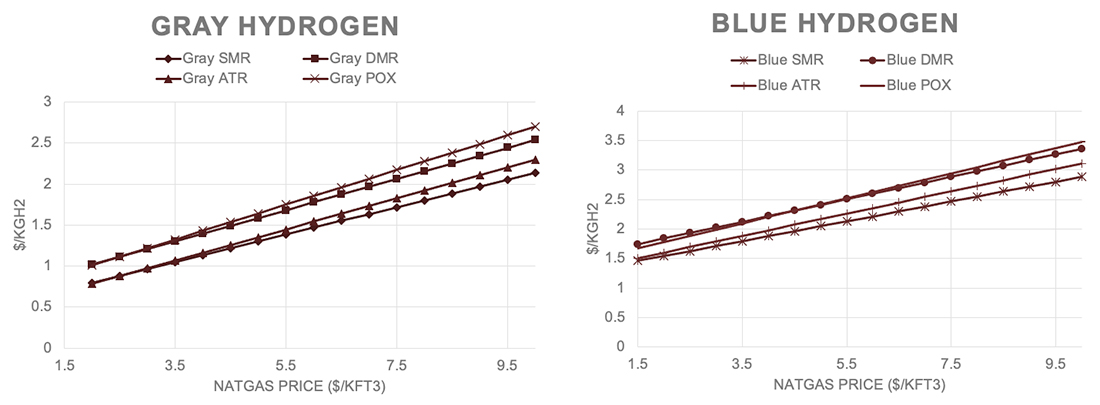
From the results, it is also clear that some technologies are more sensitive to natural gas prices than others. This is because the amount of H2 produced per mole of CH4 depends on the technology. For blue H2, the differences between technologies become more noticeable when looking at POX and ATR, which show steeper slopes compared to DMR and SMR. This is because POX and ATR require more CH4 and produce more emissions, which increases the overall cost when carbon capture is included.
The price range studied for the CCS cost sensitivity analysis was from $55/t of CO₂ to $105/t of CO₂. This range falls within the values introduced by the Internal Energy Agency (IEA) and the U.S. Congressional Budget Office, which were used for the cost modeling.14,15 The results for this analysis are shown in FIG. 3. For this study, the technologies evaluated were SMR and ATR, as they are the most commonly used in the industry.
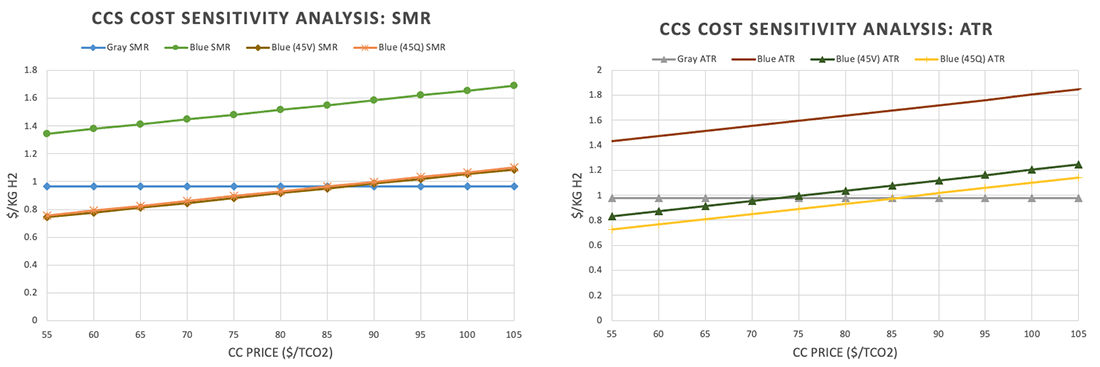
For SMR, in this specific case, the incentives received from 45V are equal to those from 45Q. This means that, regardless of which incentive is chosen, the same cost of production results. Additionally, if the CCS cost is kept below $85/t of CO₂, the full cost of CCS is offset by the tax credit, making the cost of blue H2 lower than that of gray H2.
The results for ATR with the 45Q incentive are very similar to those of SMR. When the CCS cost remains below $85/t of CO₂, the tax credit fully offsets the cost. However, because ATR produces more emissions than SMR, it does not benefit as much from the 45V tax credit. If 45V is selected, the CCS cost would need to stay below $75/t of CO₂ to be fully covered. This could also change depending on the carbon capture percentage, as that affects eligibility for the credit. This will be explored further in the next section.
Next, the carbon capture percentage analysis was done to understand how eligibility for the tax credits changes based on the carbon capture rate. Similar to the CCS cost analysis, the focus in this section is on SMR and ATR. The results are shown in FIG. 4.
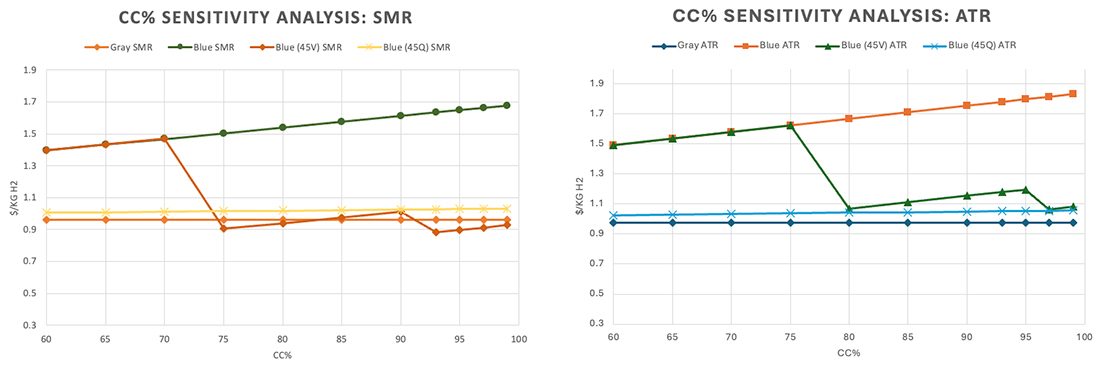
The results for SMR suggest that the technology becomes eligible for the $0.75 tier of the 45V credit with a carbon capture percentage at or above 93%. This capture rate also represents the best economic outcome, as increasing the percentage beyond that leads to higher costs without any additional incentive. A similar pattern is seen with the $0.60/kg H₂ tier, where SMR is eligible between 75% and 90% carbon captured. In this case, the incentive is most beneficial at the lower end of eligibility (i.e., 75% capture). In both the 75% and 90% cases, blue H2 ends up with a lower cost compared to gray H2. It is important to note that while 45V offers the best economic benefit as long as the capture percentage is > 75%, the credit is very sensitive to small changes. The capture percentage must be carefully considered to get the most value out of the credit. On the other hand, the benefit from 45Q appears to remain steady throughout the range. In this case, the resulting cost is slightly higher than gray H2, but that is highly dependent on the cost of CCS, as seen in the previous sensitivity analysis.
ATR does not benefit as much as SMR from the 45V credit since it produces more emissions and the overall CCS cost is higher. However, just like SMR, the highest economic benefit under 45V occurs at the start of each eligibility tier. In this case, ATR becomes eligible for the $0.60/kg H₂ tier at 80% capture, and for the $0.75/kg H₂ tier at 97%. Still, 45Q appears to provide the best overall economic benefit for ATR, offering a more stable and lower cost regardless of the capture percentage.
The last analysis performed was the GHG sensitivity analysis. While the model assumes GHG emissions (excluding CO₂) to range between 0.8 kg CO₂e/kg H₂ and 1.05 kg CO₂e/kg H₂ depending on the technology, it is still valuable to understand how eligibility for the 45V tax credit could change if GHG emissions were higher. These emissions are generally difficult to estimate and are often underestimated. Because of this, it is important to consider what those values could look like in the future as estimation technologies improve. For context on how easily GHG values can increase, the CO₂ equivalency of CH4 is 28 kg CO₂e per kg CH₄.11 This means that only 0.036 kg of CH4 emissions would raise the GHG total by 1 kg CO₂e. The results for this analysis are shown in FIG. 5.
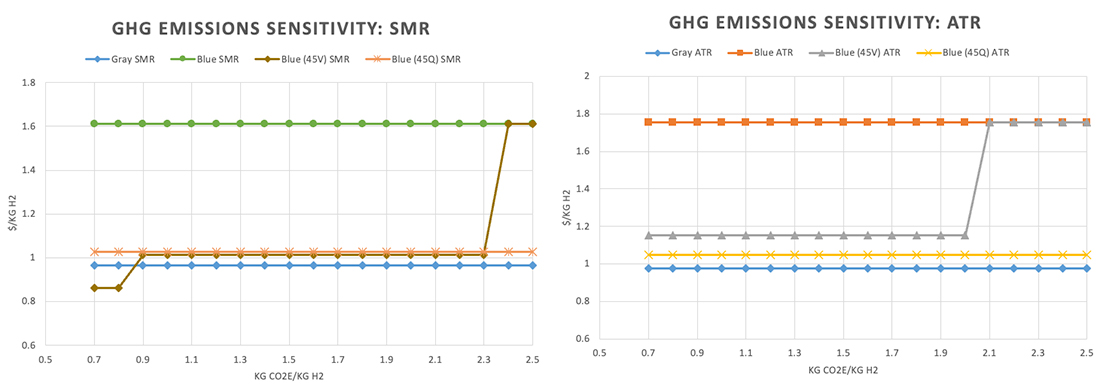
In the case of SMR, with a carbon capture percentage > 90%, the GHG emissions must be below (not equal to) 0.9 kg CO₂e/kg H₂ to qualify for the $0.75/kg H₂ tier. This value also matches the current estimated emissions, meaning that the capture rate needs to stay at or above 90% (which is the assumption used for this analysis) to qualify. This highlights how sensitive eligibility is to small changes. A variation in the estimation method or an update in the GREET model could cause the technology to lose eligibility for that tier.
On the other hand, the $0.60/kg H₂ tier appears to be more stable, since eligibility is not lost unless emissions exceed 2.3 kg CO₂e/kg H₂. It should also be noted that eligibility could change if indirect emissions increase. Additionally, the 45V tax credit only provides a cost advantage when the technology qualifies for the $0.75/kg H₂ tier. Once eligibility for that tier is lost, the total production cost becomes the same as if 45Q had been selected. In contrast, ATR does not qualify for the $0.75/kg H₂ tier within the emissions range studied. Additionally, the overall cost of production is lower when 45Q is selected compared to 45V, regardless of which tier the technology would qualify for. Since 45Q is not affected by GHG emissions, it remains a more consistent and economical option for ATR.14,15
To summarize the results, the overall cost ranges of H2 production were estimated using the previous analyses. Assumptions for the mid-range case included a capacity of 0.3 MMtpy of H₂, a natural gas price of $3/kft³, a carbon capture cost of $90/t of CO₂ and a carbon capture rate of 93%. For electrolysis, oxygen was assumed not to be sold, as that reflects the actual cost of H2 production.
To determine the overall cost ranges, the results from the sensitivity analyses were used to define the minimum and maximum values. The costs of CH4 reforming technologies were averaged to estimate the gray and blue H2 production costs. For electrolysis, the lower end of the range includes the case where oxygen is sold as a byproduct, which helps reduce the total cost. The results are shown in FIG. 6.
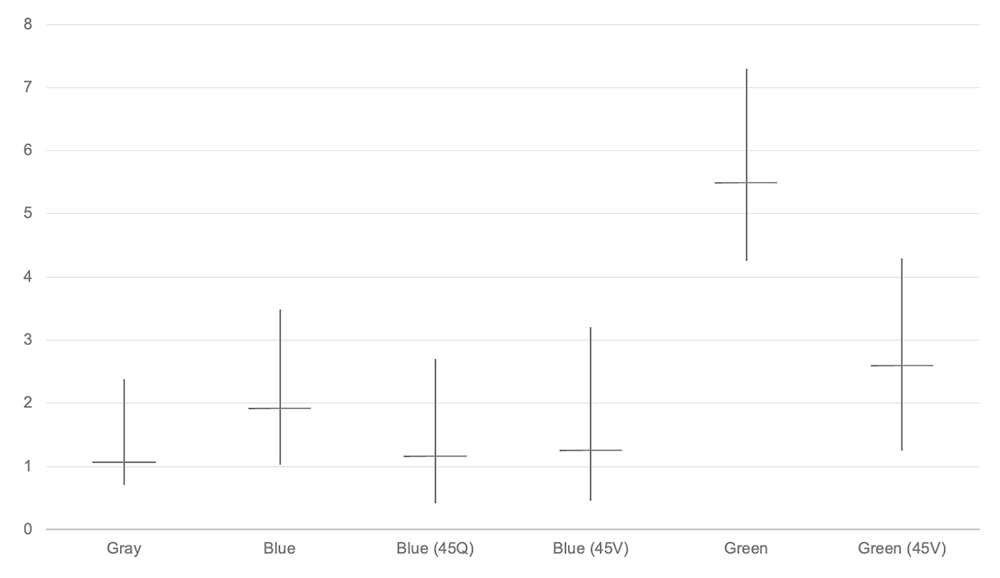
The results show that federal incentives can make blue H2 cost-competitive with gray H2. While blue H2 with incentives is still slightly more expensive, the gap between blue and gray is significantly reduced. The cost range for blue H2 with incentives is also wider than that of gray H2, showing that blue H2 has the potential to be produced at a lower cost depending on the conditions.16,17
Conversely, while green H2 receives a higher monetary incentive compared to blue, it remains more expensive than both gray and blue H2. Still, the gap between the technologies is reduced, supporting the potential for green H2 to become a viable option in the market. The lower end of the cost range for green H2 gets closer to that of blue and gray, which highlights the value of exploring additional ways to reduce costs, such as selling the oxygen produced during electrolysis.
Takeaways. The results demonstrate that federal incentives play a key role in the competitiveness of low-carbon H2 production technologies. The Clean Hydrogen Production Tax Credit (45V) can significantly reduce production costs, particularly for technologies that meet the lowest carbon intensity thresholds. However, 45V is highly sensitive to emissions, carbon capture efficiency and other input assumptions. In contrast, the Carbon Capture and Sequestration Tax Credit (45Q) tends to provide a more stable and predictable cost reduction across CH4 reforming pathways, especially when higher emissions make eligibility for 45V uncertain.
H2 production costs fluctuate significantly based on capacity, natural gas prices, carbon capture rates and associated costs. The introduction of federal incentives introduces another layer of complexity, as eligibility criteria become critical to determining whether a project qualifies for the maximum credit. Small changes in emissions or capture percentage can lead to large shifts in the value of the incentive and, in some cases, disqualify the technology from higher credit tiers.
Ultimately, the most cost-effective H2 production pathway will depend on the specific objectives, emissions profile and operational constraints of the producer. There is no universal best choice, as each technology and incentive combination presents trade-offs that must be evaluated within the context of the producer’s priorities and long-term strategy. H2T
LITERATURE CITED
1 Alsuhaibani, A. S., S. Afzal, N. Elbashir and M. El-Halwagi, “An evaluation of shale gas reforming technologies—Part 2: Cost and carbon intensity estimation,” Gas Processing & LNG, October 2022, online: http://gasprocessingnews.com/articles/2022/10/an-evaluation-of-shale-gas-reforming-technologies-part-2-cost-and-carbon-intensity-estimation/
2 Atilhan, S., S. Park, M. M. El-Halwagi, M. Atilhan, M. Moore and R. B. Nielsen, “Green hydrogen as an alternative fuel for the shipping industry,” Current Opinion in Chemical Engineering, Vol. 31, March 2021, online: Green hydrogen as an alternative fuel for the shipping industry - ScienceDirect
3 Kazi, M.-K., F. Eljack, M. M. El-Halwagi and M. Haourai, “Green hydrogen for industrial sector decarbonization: Costs and impacts on hydrogen economy in Qatar,” Computers & Chemical Engineering, Vol. 145, February 2021, online: Green hydrogen for industrial sector decarbonization: Costs and impacts on hydrogen economy in qatar - ScienceDirect
4 U.S. Environmental Protection Agency (EPA), “Summary of Inflation Reduction Act provisions related to renewable energy,” March 2023, online: Summary of Inflation Reduction Act provisions related to renewable energy | US EPA
5 U.S. Department of the Treasury (IRS), “Credit for production of clean hydrogen and energy credit,” Federal Register, January 2025, online: Federal Register :: Credit for Production of Clean Hydrogen and Energy Credit
6 U.S. Department of Energy, “GREET: Greenhouse gases, regulated emissions, and energy use in technologies,” online: GREET | Department of Energy
7 Evergreen Collaborative, “Public money is funding carbon sequestration: IRS must demand oversight,” June 2024, online: Public Money Is Funding Carbon Sequestration. Here’s How IRS Must Demand Oversight. | Evergreen Action
8 U.S. Clean Air Task Force, “Carbon capture and the Inflation Reduction Act,” 2023, online: ira-carbon-capture-fact-sheet.pdf
9 International Energy Agency (IEA), “Inflation Reduction Act 2022: Sec. 13104– Extension and modification of credit for carbon oxide sequestration,” online: Inflation Reduction Act 2022: Sec. 13104 Extension and Modification of Credit for Carbon Oxide Sequestration – Policies - IEA
10 Singh, S., “Shades of gray, blue and green: Future of (sustainable) hydrogen economy,” Forbes, June 2023, online: Shades Of Gray, Blue And Green: Future Of (Sustainable) Hydrogen Economy
11 U.S. Department of Energy, “Financial incentives for hydrogen and fuel cell projects,” Office of Energy Efficiency & Renewable Energy, online: Financial Incentives for Hydrogen and Fuel Cell Projects | Department of Energy
12 Astrodyne TDI., “Understanding power requirements for hydrogen generation,” online: Understanding Power Requirements for Hydrogen Generation
13 U.S. Energy Information Administration (EIA), “Natural gas industrial prices. U.S. Department of Energy, March 26, 2025, online: Natural Gas Industrial Price
14 Baylin-Stern, A. and N. Berghout, “Is carbon capture too expensive?” International Energy Agency (IEA), February 17, 2021, online: https://www.iea.org/commentaries/is-carbon-capture-too-expensive
15 U.S. Congressional Budget Office, “Carbon capture and storage in the United States,” December 2023, online: https://www.cbo.gov/system/files/2023-12/59345-carbon-capture-storage.pdf
About the authors

VALERIA ALVARADO TEJEDA is an MS student at the Artie McFerrin Department of Chemical Engineering, Texas A&M University, College Station, Texas (U.S.). She earned her BS degree in chemical engineering from the same department. Her research interests include H2 production, process integration, economic analysis and environmental regulations.

MAHMOUD M. EL-HALWAGI is a Professor and holder of the Bryan Research and Engineering Chair and the Managing Director of the Gas and Fuels Research Center at Texas A&M University, College Station, Texas (U.S.). Dr. El-Halwagi’s main areas of expertise are sustainability, process integration, synthesis, design, operation and optimization. He is the author of three textbooks, the co-author of more than 500 referenced papers and book chapters, and the co-editor of 10 books. Dr. El-Halwagi is the recipient of several awards, including the AIChE Computing in Chemical Engineering Award and the AIChE Sustainable Engineering Forum Research Excellence Award. He earned his BS and MS degrees from Cairo University and his PhD from the University of California, Los Angeles (U.S.).

RENE ELMS is a Professor of Practice at Texas A&M University’s College of Engineering. Her primary academic and industrial experiences are in the fields of process design, simulation and optimization in the oil and gas industry, energy transition, biofuels, sustainability and process safety. Dr. Elms holds a PhD and an MS degree in chemical engineering and two BS degrees in biochemistry and genetics from Texas A&M University.
Related Articles
Connect with H2Tech
